First attempt delivery rate (FADR) is the share of deliveries completed on the first try, and it is one of the clearest measures of last mile execution quality, cost control and customer satisfaction. Order volume and fleet utilization show how busy a network is. FADR shows how well it delivers.
Every missed first attempt adds stem miles, a second visit, depot handling and customer service contacts. For logistics managers building an internal business case, FADR is a practical starting point because it turns an operational problem into a number.
What is the first attempt delivery rate (FADR)?
Your FADR is the percentage of total outbound shipments that are successfully completed on the initial delivery drop without requiring a second attempt, drop re-routing, or a return to the regional depot.
How do you calculate FADR?
FADR is the number of deliveries completed on the first attempt, divided by the total number of deliveries attempted for the first time, multiplied by 100.
FADR = (Deliveries Completed on First Attempt ÷ Total Initial Delivery Attempts) × 100
Example: If a commercial fleet undertakes 10,000 deliveries in a week and successfully completes 9,200 at the first attempt, the FADR is 92%. The remaining 800 packages represent failed first attempts that require re-delivery or return.
FADR Industry Benchmarks
A good FADR is one that is high for your market and stable over time. Published benchmarks vary by country, delivery type and by how each source defines a first attempt, so treat them as context and compare against your own trend first.
A FADR of 100% is not a realistic target, because some obstacles cannot be planned away, such as a sudden absence, severe weather or an unexpected site closure.
The Financial Impact of FADR
A failed first attempt costs more than the delivery it replaces, because it adds a second trip and extra handling. To size the cost for your own operation, multiply your failed first attempts per year by your cost per failed attempt.
Take a network with 500,000 deliveries a year. At an 88% FADR, 60,000 deliveries fail on the first attempt. At 92%, 40,000 do. That is 20,000 fewer repeat deliveries a year, and multiplying that number by your own cost per failed attempt gives the annual saving.
Which KPIs should you track alongside FADR?
Track four supporting KPIs next to FADR: cost per failed delivery, redelivery rate, on time delivery rate and customer retention after a failed delivery. Together they give a complete picture of last-mile delivery.
| Metric | What it measures | Why it matters |
|---|---|---|
| 1. FADR | The headline metric. This shows the percentage of deliveries completed successfully at the first time of asking. | Serves as the primary indicator of schedule accuracy, address quality, and real-time customer communication effectiveness. |
| 2. Cost per Failed Delivery | The total direct cost incurred when a parcel cannot be delivered successfully, including extra mileage, extra labor, vehicle wear, depot re-scanning, and customer service escalation. | Converts abstract operational failure rates directly into cold, hard financial impact, providing the quantitative data needed to justify mitigating investments. |
| 3. Redelivery / Reattempt Rate | The percentage of failed first-attempt packages that are successfully completed on a second or third attempt and how many days it takes to complete the cycle. | Highlights depot processing efficiency and reveals whether a network is stuck in an expensive, multi-day re-try loop or is able to resolve delivery failures quickly. |
| 4. On-Time Delivery (OTD) Rate | The percentage of orders arriving within a promised service window, such as a 2-hour morning window. | OTD and FADR are related but different. A delivery may be on time (arriving during the promised 10:00 AM window, for example) but still fail if the recipient is absent or the address is incorrect. Conversely, a driver may complete a delivery on the first attempt, but if they arrive two hours late, OTD suffers. Monitoring both ensures you do not sacrifice punctuality for completion. |
| 5. Customer Retention Rate After a Failed Delivery | The percentage of customers who place a subsequent order following an instance of a missed or delayed initial delivery. | Missed drops do not just create operational expense; they threaten customer retention. Studies indicate that up to 70% of consumers are hesitant to order from a seller after simply hearing of a poor delivery experience. They don’t even have to experience a delivery failure themselves. This is why FADR is such a critical driver of revenue. |
What improves first attempt delivery rate?
To raise your FADR from industry average levels to a best-in-class standard, enterprise operations must combine three strategic levers:
1. Realistic time windows:
A high FADR begins with a route plan that can be met. For instance, PTV OptiFlow plans routes around customer time windows, vehicle capacity and driver breaks, using time-dependent traffic so planned arrival times reflect the traffic expected at that hour.
2. Real time visibility:
To improve FADR you need to see delays while there is still time to act. A transport control tower such as PTV Axylog tracks vehicle positions by GPS, calculates ETAs, detects delays early and supports electronic proof of delivery.
3. Offering alternative drops:
Incorporating out-of-home collection points such as smart lockers or parcel pickup shops provides a solution to doorstep failures. With roughly a quarter to a third of consumers in major markets regularly using out-of-home collection, integrating a dedicated PUDO network strategy ensures that packages reach a secure delivery point on the first attempt, regardless of whether a recipient is home or not.
How can AI help planners improve first attempt delivery rate?
AI can help planners test a planning change before they commit to it, which is where much of the work begins once FADR points to a cause. It cannot replace the measurement or the planner’s judgment.
Gartner notes that most agentic AI features in supply chain planning today improve the user experience, for example by interpreting questions and offering recommendations, and do not yet change how decisions are made – a useful check for any AI planning tool is whether real optimization runs behind the conversation, and whether a person approves every action.
PTV Mira is built on that approach. A planner asks a planning or analysis question in plain language. PTV Mira runs real optimization and simulation, compares scenarios and explains the results, and the user approves every action. If FADR points to late arrivals, for example, a planner can ask how a change to time windows or depot assignments would play out in the route plan. As with any model, the results depend on the quality of the input data.
How do you start improving your FADR?
Start by calculating FADR for the last four weeks, broken down by failure reason, and compare it with your own trend before you compare it with anyone else’s. The largest reason shows where to act first. To understand what sits behind each reason, read our companion guide, Why deliveries fail on the first attempt and how to fix them.
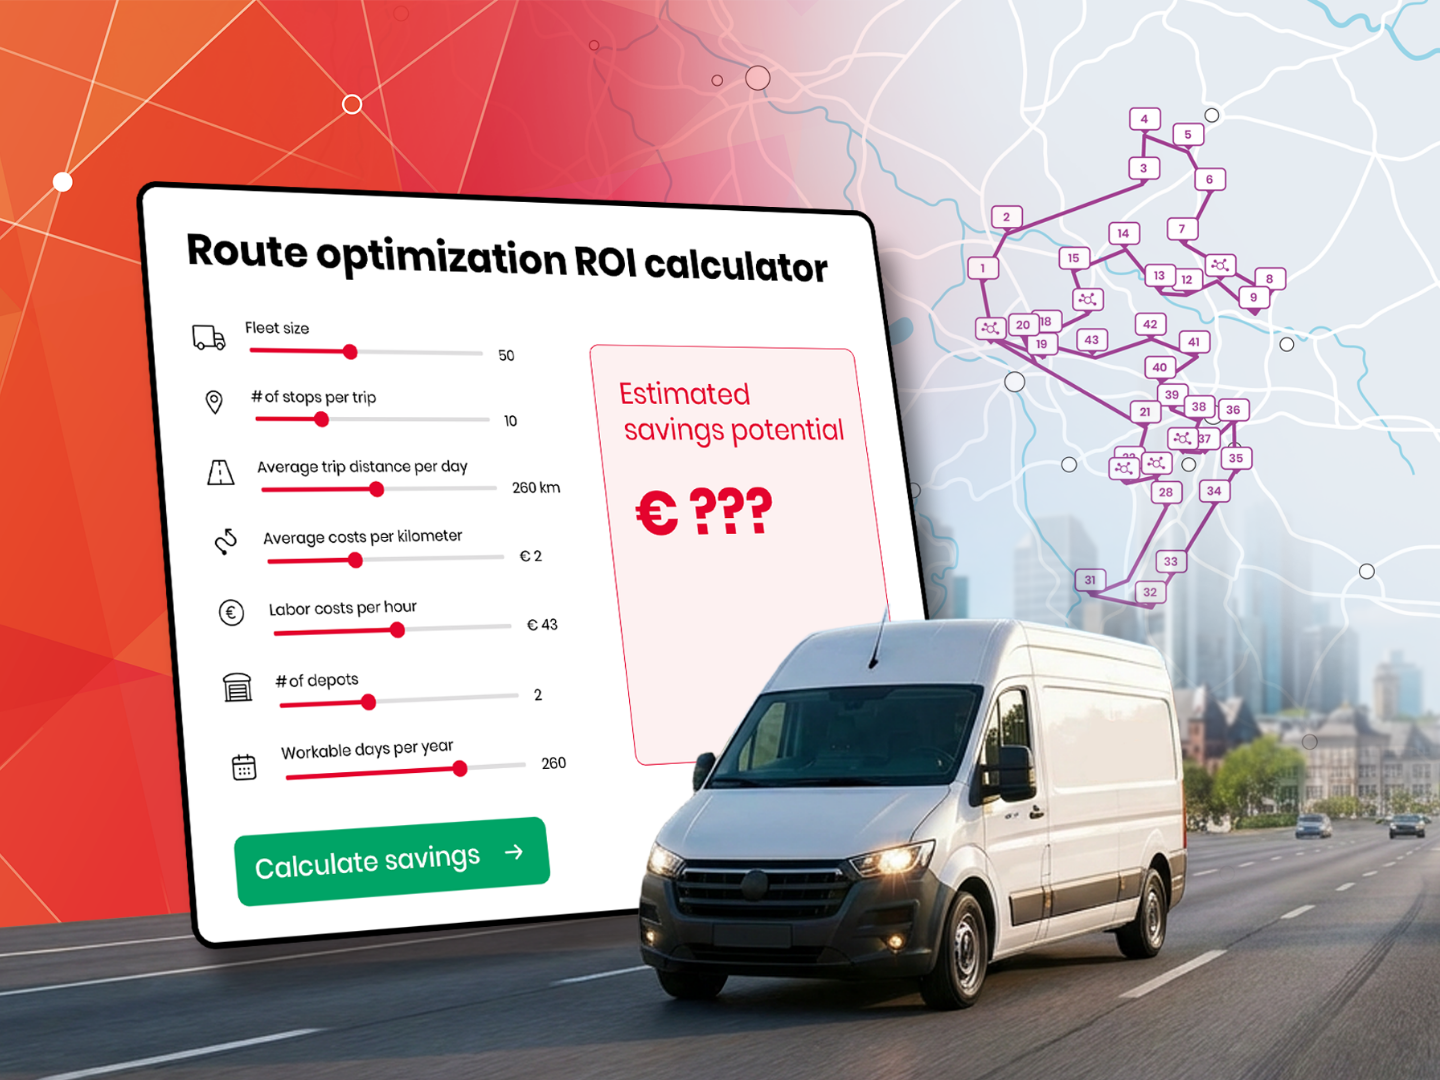
Once you know where the failures come from, the next question is what better planning could be worth. If you are building the business case, our savings calculator gives an indicative estimate of what better route planning could save, based on your vehicles, stops per day and depots.