

Peak seasons may vary in different industries, but they all have the same impact. Volumes spike, delivery windows tighten, depot throughput gets stretched, and planners start making expensive decisions under pressure.
It’s a widespread problem: according to CEVA Logistics’ analysis of the 2025 peak season, 91% of retailers report revenue losses linked to supply chain issues during peak periods. More trucks, more drivers, more subcontractors, and more temporary sites can help, but they do not solve the underlying problem on their own. In peak season logistics, what matters most is how the network is designed, how demand is allocated, and how routes are built across your full operation.
This article explains smart logistics network optimization for peak seasons and covers everything optimization can do for your team in terms of service, cost control, and planning productivity.
What is smart network optimization for peak seasons?
Distribution networks are designed around average order profiles, stable cut-off times, and a familiar mix of depots, vehicles, and carrier capacity. Peak season changes all of that. Order density shifts, service expectations rise, and everything and everyone – in your network is suddenly under a lot more pressure than usual.
Smart network optimization is the process of adjusting your network for peak conditions instead of treating peak as a larger version of a normal day. In practice, it involves reviewing depot roles, capacity estimates, routing logic, and service rules, so your operation can handle more volume efficiently. Optimization is a core component of network design for peak season, because it helps your team plan the best routes and choose which depots should handle them.
The four layers of smart logistics network optimization
A strong peak planning approach involves four layers:
- Structure: Review the role and location of depots, hubs, cross-docks, and temporary distribution centers for peak.
- Routing: Optimize routes and tours across multiple depots, fleets, and service areas.
- Constraints: Manage vehicle capacity, depot throughput, cut-off times, loading windows, driver hours, and service commitments.
- Scenarios: Test different peak strategies before the business commits money, people, and fleet.
It is difficult to work across these four layers without route optimization software built specifically for logistics. Good planning tools help your planners work across these layers in one connected workflow instead of splitting the job across spreadsheets, static rules, and separate systems. They make it easier to compare options, test different peak setups, and connect routing and planning logic to the systems around them.
3 common challenges in peak season planning (and why simple tools fail)
1. Volume surges and compressed time windows
Peak season brings more stops, more parcels, and far less room for error. Time windows tighten because customer expectations rise and service promises get harder to keep. Last mile delivery during peak season gets harder fast because route density may improve in some areas while travel times, failed delivery risk, and handover complexity rise in others.
That is why manual planning often starts to break right when the operation needs the most control. Spreadsheet-based workflows that work under normal conditions start to fail when orders double or triple. A rule such as nearest depot or fixed route territory may stop making sense once throughput limits, driver shifts, and customer cut-off times start clashing.
2. Hidden bottlenecks in your network
Peak season exposes bottlenecks that normal operations often hide. A depot may have enough floor space but not enough loading capacity. A route may look efficient on distance but still break legal driver hours once the planner adds real stop times. One region may suddenly generate much higher cost-to-serve in peak season because orders fragment, delivery windows narrow, or the local carrier mix gets too expensive.
That is why planners need to look at the full system instead of isolated routes or depots. A network can miss service levels even when it has enough vehicles overall, simply because the wrong depot carries the wrong load. Peak season capacity planning usually starts with finding those hidden operational limits before they turn into daily firefighting.
3. Simple tools cannot adapt when the network needs to change
Spreadsheets and basic TMS rules usually assume a fairly fixed operating model. They can build plans around a set network, but they struggle when the network itself needs to change. That makes it hard to answer practical questions such as whether a temporary depot would reduce distance, whether a different carrier mix would protect time windows, or whether a new cut-off time would overload a specific hub.
They also struggle to optimize routes and network structure together. They may create routes from a given depot, but they do not help planners test the wider setup in a meaningful way. Using optimization software for peak demand helps your planners make better decisions before and during peak.
Smart network optimization for peak season planning in 4 steps
Courier, Express and Parcel: Preparing for parcel volume spikes around holidays
A parcel carrier heading into November and December may face two or three times normal daily volume in specific urban regions. The instinctive response is often to add vans and subcontractors everywhere. A smarter response is to test where the volume should flow, whether an extra evening delivery wave would help, and whether temporary distribution centers for peak would make sense near key metro areas.
This gives planners a more disciplined view of how to plan logistics for Black Friday / holiday peak. Instead of guessing, they can compare what happens when they shift demand between hubs, change route territories, or open a temporary site for a short period. Better allocation can reduce last-minute outsourcing, improve on-time performance, and show more clearly which bottlenecks are truly structural.
These are largely the same depot, line-haul, and service-level decisions CEP planners weigh year-round — peak season just raises the stakes and compresses the timeline. For a closer look at that broader decision framework, see smart network optimization: key decisions for courier, express, and parcel planners.
Smart network optimization for peak season planning in 4 steps
Step 1. Model your current network and constraints
The first step is to create a clear overview or model of your network as it actually runs. That means listing and mapping out all your depots, hubs, cross-docks, customer zones, service regions, and any temporary facilities already under consideration. It also means listing all the constraints that influence how you operate: depot throughput, loading times, vehicle types, truck restrictions, service times, cut-off times, time windows, and driver regulations.
Using constraint-based route planning enables your teams to create that overview without leaving out any relevant information. PTV OptiFlow, for example, models time windows, driver rules, vehicle capacity, and other operational constraints directly inside the planning process. This is a large part of why it can achieve up to 95% feasible planning accuracy, so the plan you build in this step reflects real operating conditions rather than an idealized version of your network.
Step 2. Simulate peak scenarios
Once the team has a full overview of your current network, the next step is logistics simulation for peak volumes. This is where planners test different demand profiles, service assumptions, and geographic changes. Volume in one metro region may rise by 30%. Another region may double because of a seasonal promotion. A major customer may change cut-off times or ask for narrower delivery windows.
This is the stage where planners ask the hard questions. Can current depots absorb the change? Do driver hours still work? Which routes stop working? Do costs spike in one part of the network? Scenario planning in logistics matters here because it lets teams compare options before they commit temporary capacity or emergency carrier spend. For example, a logistics AI agent like PTV Mira lets your team ask those questions and get real, personalized answers in an actual back-and-forth conversation, while PTV OptiFlow can help them test different routing and allocation scenarios inside the same planning workflow.
Step 3. Optimize network configuration and routing
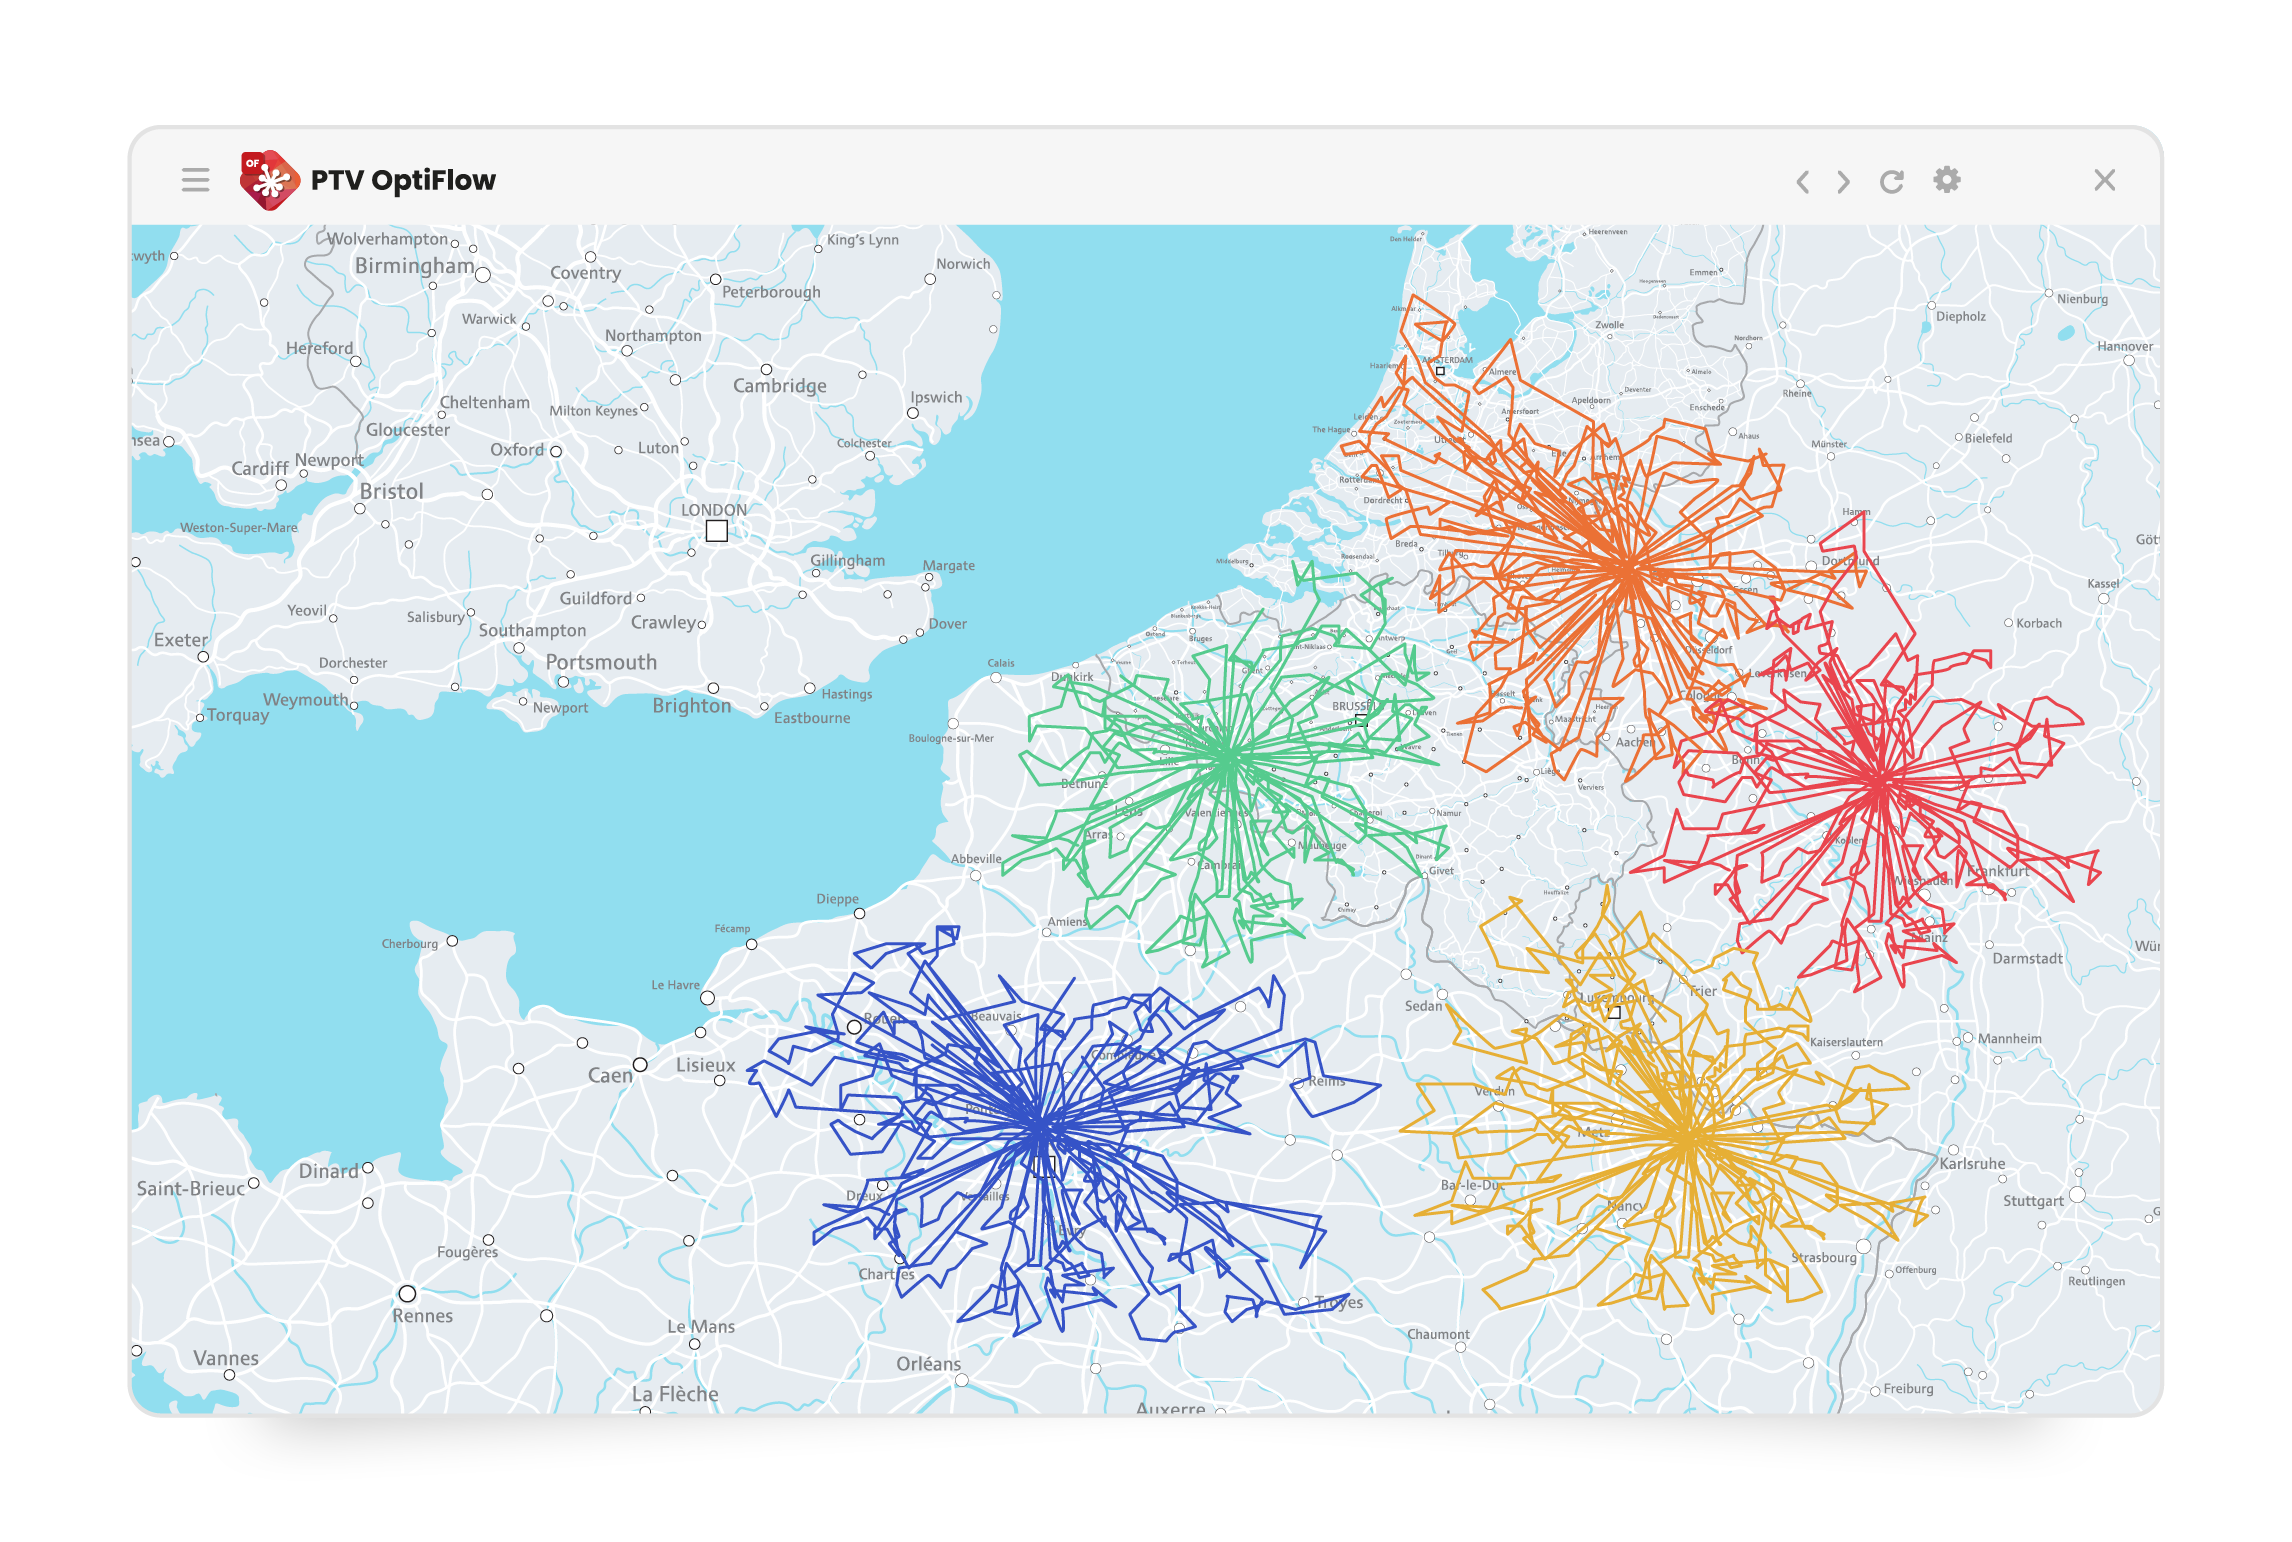
Once your team has tested the scenarios, it is time to start improving your network design. During this step, it is helpful to use software with a built-in optimization engine that can automatically suggest better customer-to-depot allocation, improve multi-depot route optimization, balance fleet use across regions, and highlight where a temporary node or cross-dock might reduce cost or protect service.
Peak planning usually creates bigger planning problems that affect allocation, route feasibility, and fleet balancing in high season. This is where logistics network design tools such as PTV OptiFlow can help by giving planners one place to work through high-volume, multi-stop, multi-depot planning at scale, rather than splitting the work across separate files and disconnected planning steps.
Step 4. Decide on peak playbook and execute
Once planners compare the scenarios, they can decide where and when to add temporary capacity, which regions need subcontracted support, how to balance owned and outsourced fleet, and whether they need to adjust service promises in a controlled way.
At that point, your team will often need to connect optimized planning output with your TMS, WMS, order systems, and execution tools, so the plan reaches every part of your organization without manual re-entry. PTV Developer, for example, provides 17 individual routing, geocoding, and map APIs that teams can mix and match to connect planning logic to the systems they already run — scaling from 10 to more than 10,000 daily routes — so orders move in cleanly and route outputs move out cleanly.
Practical use cases of smart network optimization for peak
Retail & e-commerce: Balancing store and home delivery
Retail and e-commerce networks face a different challenge. At peak, the business may need to decide whether orders should ship from stores, regional DCs, local depots, or some mix of all three. That decision directly affects cost, lead time, and operational congestion.
This is where distribution network planning and route design come together. A retailer can compare whether certain orders should flow through stores for speed or through DCs for efficiency. The goal is to manage peak season logistics in a way that controls marginal delivery cost and protects service. That is also the kind of question teams can explore much more clearly when they use tools that support both scenario work and network-aware route planning.
For the executive perspective on this shift, our interview with PTV Logistics’ Chief Commercial Officer on network design, optimization, and smart sectorization walks through how retail and last-mile leaders are approaching it in practice.
3PL / transport provider: Designing attractive peak offers
For a 3PL, smart network optimization can become part of your commercial offer. It enables you to model feasible service levels, test fleet requirements, and estimate true cost-to-serve in peak season before making commitments. If you operate a multi-leg, multi-depot network, running simulations before making actual changes is the safer way to test these scenarios. PTV OptiFlow, for example, lets your teams test peak setups and confirm whether a service model will hold up in practice before you commit to it commercially.
Key KPIs and ROI drivers for peak-ready logistics network optimization
What to measure before and after
A useful peak optimization program starts with measurable outcomes. The most important KPIs are:
- Cost per stop or per parcel: How efficiently is the network handling each delivery under peak pressure?
- On-time delivery rate within time windows: Can the operation keep service promises as volume rises?
- Number of emergency routes: How often does the plan fail and force last-minute fixes?
- Volume sent to ad hoc carriers: How much peak demand is the core network unable to absorb on its own?
- Fleet utilization across owned and subcontracted resources: How well is the operation using available vehicle capacity across the full fleet mix?
- Depot throughput: How much volume can each site process before bottlenecks build up?
- Planner workload: How much time are planners spending managing exceptions instead of improving the plan?
Each KPI tells part of the story. If on-time performance improves but emergency outsourcing doubles, the network has not really improved. If cost per route falls but depot congestion gets worse, the improvement may not hold through the full peak. Smart network optimization gives teams better control across service, cost, and workload.
Typical ROI drivers
When investing in route optimization technology, ROI is always a major business concern. When used effectively, this software helps you implement network changes that are proven to increase ROI even more for most organizations. These include:
- Fewer temporary depots: Fewer sites reduce setup, staffing, and operating costs.
- Better-located temporary depots: Better placement cuts travel distance, improves coverage, and supports service levels with less waste.
- Better balancing of demand between depots: A more even load prevents overload in one site while other sites still have spare capacity.
- Less overtime: Lower overtime reduces labor costs and eases operational strain.
- Fewer emergency carrier contracts: Fewer last-minute carrier bookings cut premium transport spend and give the team more planning control.
- Higher asset utilization: Better use of fleet and driver capacity increases the value of existing resources.
- Better service predictability: More reliable performance protects the customer experience and reduces the cost of missed windows and failed deliveries.
- Stronger cost visibility before the season starts: Earlier cost clarity helps teams make better capacity decisions and avoid expensive last-minute fixes.
With better route and network planning during peak seasons, your planners cut distance, reduce wasted planning time, and improve the use of fleet and labor. During peak, each gain drives the ROI of your optimization software even further more because every inefficiency costs more once volume rises.
How to get started with smart network optimization for your next peak
Start with data you already have
Most logistics teams already have the core inputs they need to begin. Start by pulling together:
- Historical orders and shipments: Past order and shipment data helps you spot volume patterns, regional demand shifts, and the pressure points that showed up in previous peaks. You will usually find it in your TMS, ERP, OMS, or BI reports.
- Depot master data: Site data gives you the basics on locations, capacities, operating hours, and local constraints at each facility. This is often found in your WMS, TMS, ERP, or local operations records.
- Vehicle master data: Fleet records show which vehicle types you have, how much capacity they offer, and which restrictions apply to them. You can normally pull this from your TMS, fleet management system, telematics platform, or transport operations files.
- Service times: Stop-level handling times help planners estimate how long each delivery or pickup will really take in the field. Look for this in your route history, driver app data, proof of delivery records, or planner input.
- Time windows: Customer delivery windows show where service promises tighten the plan and reduce routing flexibility. You can usually pull these from your OMS, TMS, CRM, or customer service records.
- Cut-off times: Order cut-offs tell you when work needs to enter the network if the plan is still going to hold. This information is often available in order management rules, warehouse workflows, customer agreements, or dispatch processes.
- Carrier usage data: Subcontracting data makes it easier to see where the operation already relies on external support during busy periods. You will usually find that in your TMS, carrier invoices, procurement records, or transport planning reports.
Start by putting that information in one place and checking it against a few practical peak questions. Which depots hit their limits first? Where do time windows cause problems? Which regions trigger the most subcontracting, overtime, or extra mileage? That gives your team concrete actions to work with straight away.
For mid-market teams, that is often enough to get started. You do not need a perfect model on day one. The goal is to create a workable planning view that reflects how the network actually runs and lets you reliably test realistic peak scenarios.
Build a repeatable planner workflow
The strongest peak operations follow a repeatable workflow: a seasonal network health check, a baseline scenario, a set of stress scenarios, agreed trigger points for opening extra capacity, and a clearer decision process for changing service promises or fleet mix.
The workflow needs to work intuitively. Software tools need to be designed for your planners, not just IT specialists. That is another reason why teams often respond well to tools that let them test scenarios, compare options, and understand the operational effect without building a heavy process around them. For example, PTV Mira lets teams simply ask real logistics questions directly, while PTV OptiFlow can help them turn those questions into concrete planning scenarios.
A good way to start is to run a focused peak season simulation before the business decides to increase capacity. Map the current network, test a few credible stress cases, and compare the effect of temporary sites, depot role changes, service adjustments, and carrier mixes.
At the end of the day, if your peak planning relies on spreadsheets, fixed rules, and emergency workarounds, the issue is probably bigger than routing alone. It usually points to a network and planning problem that you can solve with better structure, better testing, and better decision support.